Topological vs. Metric distance
Basically all existing models of collective animal behaviour (bird flocks, fish schools, etc) assume that the interaction between different individuals depends on the metric distance, just as in physics. This implies, for example, that two birds 5 meters apart interact more strongly than two birds 10 meters apart.
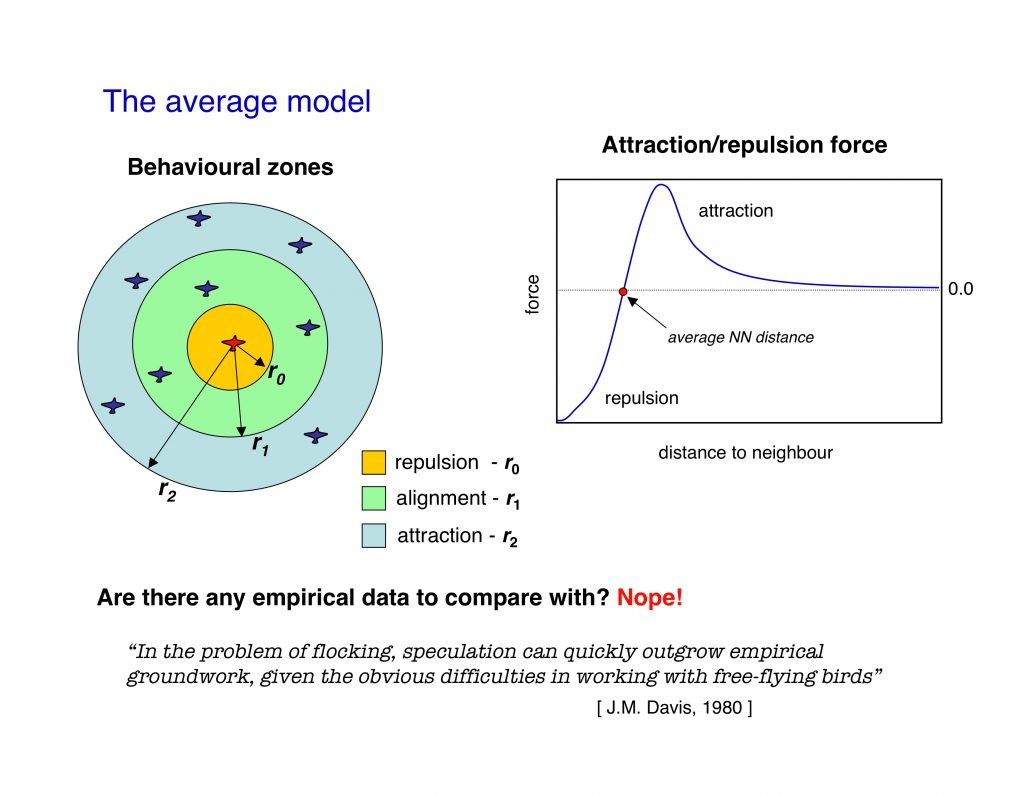
Models developed by biologists are based on a “behavioural zones” scheme, where each zone is associated to one of the three basic ingredients of all models: short range repulsion, alignment, long range attraction. Models developed by physicists, on the other hand, mostly used a single force function.
The two approaches, though, are substantially equivalent, and what matters is that they are both based on a metric paradigm.
The crucial point is that within the metric paradigm the number of neighbours each individual is interacting with is not a constant, but it depends on the density.
For example, let us assume that each bird interacts with all neghbours within a range of 5 meters. The number of neighbours within the 5 meters will be large in a dense flock, and small in a sparse flock. So, within the metric paradigm the number of interacting neighbours is not a constant, but it rather depends on the density. What is constant is the metric range of the interaction (5 meters in the example above).
The metric paradigm looks very reasonable at first sight. Animals are good at evaluating distances, so it makes sense to assume that the strenght of their mutual bonds depend on the distance. Moreover, metric models proved to be able to qualitatively reproduce flocking behaviour. Therefore, there was no reason to question the metric paradigm, in absence of empirical data. And since no empirical data were available up to know, models all used a metric interaction.
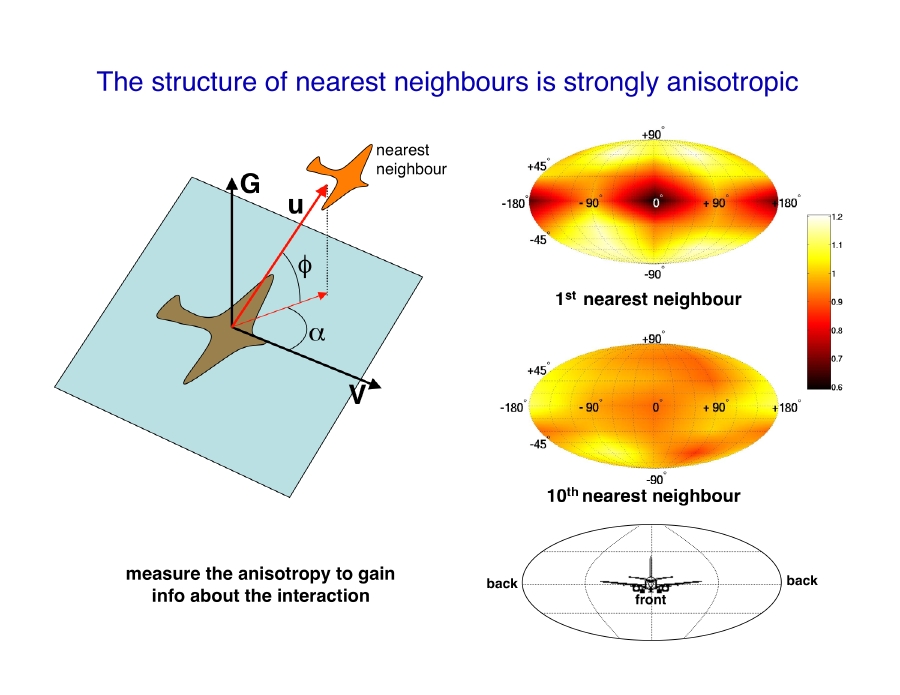
The first empirical data on large flocks of starlings were obtained by the INFM-CNR node within the STARFLAG project. By reconstructing the 3D positions of individual birds it was possible to map the average distribution of nearest neighbours (Fig.2), which provides the clearest characterization of the structure of birds within a flock.
Given a reference bird, we measure the angular orientation of its nearest neighbour with respect to the flock’s direction of motion, i.e. the neighbour’s bearing and elevation. We repeat this by taking all individuals within a flock as reference bird, and in this way we map the average spatial position of nearest neighbours.
We can think about this map as a map of the sphere around each flying bird. The centre of the map is the foward direction, the poles are the upward and downward directions. The color on a given point of the map indicates the probability that the bird’s nearest neighbour is along that particular direction.
This map shows a striking lack of nearest neighbours along the direction of motion. The structure of individuals is therefore strongly anisotropic. This anisotropy is probably related to the visual apparatus of birds. The crucial point, however, is that this anisotropy is the effect of the interaction among individuals, whatever this interaction is.
To support this claim, we compute the distribution of neighbours very far apart from the reference bird, for example for the tenth nearest neighbour (lower map in the figure). This distribution is uniform, as for a completely isotropic, non-interacting aggregation of points. This is a direct empirical indication that interaction decays with the distance: the farther apart two birds are, the lower their degree of correlation. This result also demonstrates that we can use the anisotropy to get information about the interaction. Indeed one can compute the neighbours’ angular distribution map even for second, third, fourth nearest neighbours and so on, and observe how the anisotropic structure present for nearest neighbours progressively fades away as the order of the neighbour increases.
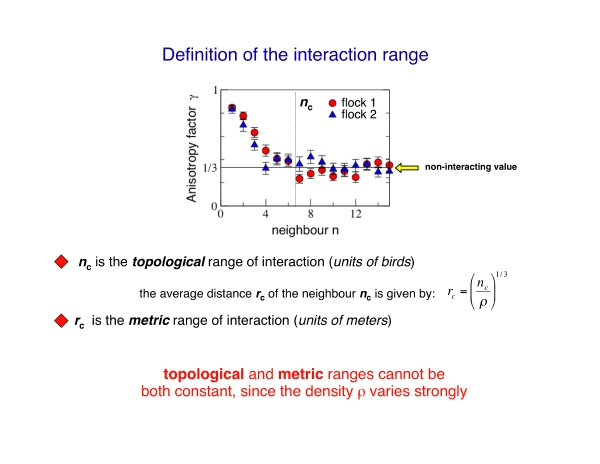
The decay of this anisotropic structure with distance can be made more quantitative by computing the anisotropy factor gamma. This quantity decays to its isotropic/noninteracting value 1/3 as the order n of the neighbour increases, in a similar way as a standard correlation function.
However, the crucial point is that n is a topological distance, that is a distance measured in units of birds, rather than meters. From the anisotropy factor we can compute the topological range, defined as the point where the anisotropy factor becomes equal to its noninteracting value. This topological range is simply the average number of neighbours each bird is interacting with.
Clearly, given the density of the flock, we can also define a standard metric distance, and thus a metric range of the interaction. The metric range of interaction is nothing else than the maximal distance of the birds within the topological range.
The important point is that the density of the flocks varies strongly from flock to flock, and this implies that the topological and metric range cannot be both constant when the density varies.
To elucidate this crucial point, let us consider two flocks with different densities. If the interaction depends on the metric distance, then the range in meters is the same in the two flocks, while the number of individuals within this range is large in the denser flock, and small in the sparser one.
Conversely, if the interaction depends on the topological distance, the range in units of birds is constant in the two flocks, while the distance of these n nearest neighbours is small in the denser flock, and large in the sparser one.
The difference between topological and metric hypothesis is stark: in the topological scenario the number of interacting individuals is fixed. On the opposite, in the metric scenario, such number varies with density; for example, within the same metric range there may be 10 birds in a very dense flock, and only 1 bird in a very sparse one. Topological and metric ranges therefore are not interchangeable characterizations of the interaction. Thus, to understand whether it is the metric or the topological distance that matters we must measure how metric and topological range depend on the flocks’ density.
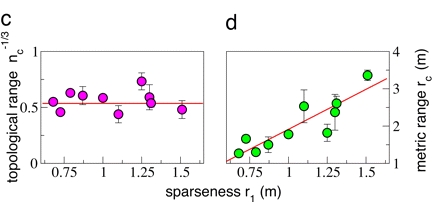
The experimental evidence clearly supports the topological scenario: there is no significant correlation between topological rane and density, whereas a clear linear correlation exists between metric range and nearest neighbour distance. The topological range is therefore approximately constant from flock to flock: the interaction is based on the topological distance, and thus the topological range is the fundamental constant. On the other hand, the metric range depends on the density, showing that it is not metric distance to rule the interaction.
On average, we find that the topological range is equal to 6.5 birds.
This result is in contrast with most models and theories of collective animal behaviour currently on the market, which all assume a metric range of interaction.
Why a topological, and not a metric interaction? Animal collective behaviour is staged in a troubled natural environment. Hence, the interaction mechanism shaped by evolution must keep cohesion in the face of strong perturbations, of which predation is the most relevant. We believe that topological interaction is the only mechanism granting such robust cohesion, and therefore higher biological fitness. A metric interaction is inadequate to cope with this problem: whenever the inter-individual distance became larger than the metric range, interaction would vanish, cohesion would be lost, and stragglers would ‘evaporate’ from the aggregation. A topological interaction, on the opposite, is very robust, since its strength is the same at different densities. By interacting within a fixed number of individuals, rather than meters, the aggregation can be either dense or sparse, change shape, fluctuate and even split, yet maintaining the same degree of cohesion. Thus, the topological interaction is functional to keeping the cohesion in the face of the strong perturbations a flock is subject to, typically predation. Moreover, there is evidence that the particular value of the topological range we find (6.5) is related to the cognitive capabilities of birds, and in particular to their pre-numeric abilities.
To have a full account of the INFM-CNR/STARFLAG results read the paper in PNAS.
