Fractal analysis of planetary topographies
There exists an overwhelming diversity of landscapes on Earth. A cornerstone of modern geomorphology came with the realization that all the different features of the terrestrial surface result from the accumulated effect of current geological agents [Lyell, 1830]. This principle established for the first time a qualitative relationship between pattern and process in geology.
More than one century later, fractal geometry gave a theoretical framework able to provide quantitative measures for the patterns of landscapes, which were identified in a first approximation as self-similar, and triggered the research on mechanistic and theoretical models to identify the underlying constructive rules responsible for their appearance.
Computational analysis of the geometry of coastlines [Mandelbrot, 1967; 1983; Boffetta et al., 2007] and river networks [Mandelbrot, 1967; Hack, 1957; Rinaldo et al., 1993; Rodríguez- Iturbe and Rinaldo, 1997; Nieman et al., 2001] placed them amongst the first natural systems quantitatively characterized. The fact that both systems display quasi-universal properties prompted the search for simple models able to account for their quantitative features. The topology of river networks seems to stem from a principle of transport optimization [Maritan et al., 1996] while the dominant 4/3 fractal dimension of coasts can be retrieved from a damping erosion model [Sapoval et al., 2004].
In comparison, global topography has received less attention, maybe reflecting that, at odds with coastlines and rivers, terrestrial topography is certainly a more complex system to analyse, since for example its geometry depends on specific features of the region analysed [Dodds and Rothman, 2000; Ivanov, 1994; Gagnon et al., 2003].
At present, one of the goals of topography analysis is to single out characteristic features with well defined scale invariant properties (in the sense used above for river networks or coasts) as a first step towards distinguishing dominant physical process, and the subsequent design of simple models able to reproduce the average geometrical properties of that region.
This ambitious goal is limited by our understanding of the complex feedback loop between the action of geological processes and the surface features of Earth. Geological agents settle the characteristics of the topography but act in turn with different strength as a function of elevation [Weissel et al., 1994], the latter being a variable itself on geological time scales.
The use of isolines, defined as the set of points at a fixed elevation, appears then as a suitable solution to undertake a quantification of topography [Isichenko, 1992; Kondev et al., 2000]. The fractal dimension D, a measure of the degree of self- similarity of a curve, will be used to characterize in a first approximation the geometrical properties of isolines.
In this study we measured the local fractal dimension of isolines on the whole planetary surface. A statistical analysis of the results advances in establishing a correspondence between topographic features and intervening geological agents.
We have analysed the dependence of the average fractal dimension D with three relevant parameters, each corresponding to one major possible direction of anisotropy: longitude, latitude and elevation. Averages with respect to the other two parameters are performed in each case.
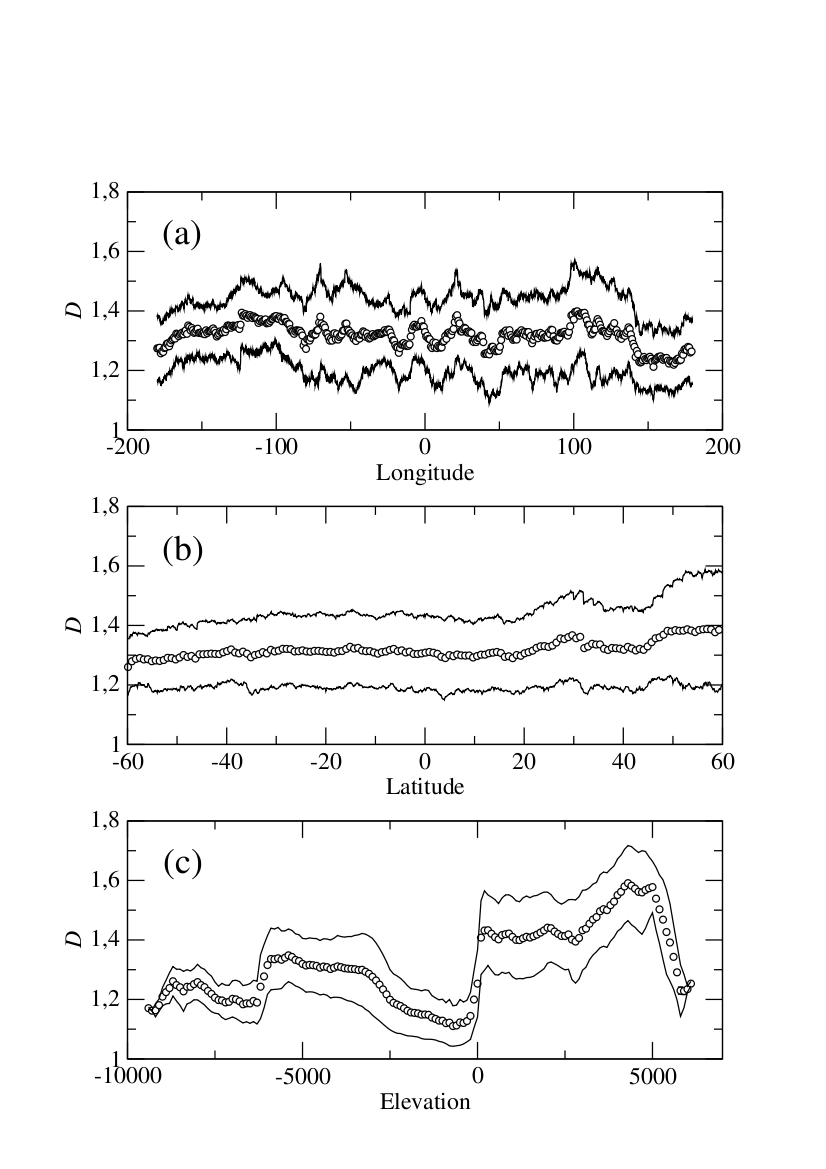
Fig 1. In the top panel (a) we show the behaviour of the average fractal dimension versus the longitude; in the middle panel (b), the average is plotted as a function of the latitude; and in the lower panel (c) we plot the average fractal dimension versus the elevation.

A close inspection of the data reveals that, on Earth, the average fractal dimension D is only weakly dependent on longitude (Fig. 1a) or latitude (Fig. 1b) while it shows a complex dependence on elevation (Fig. 1c).

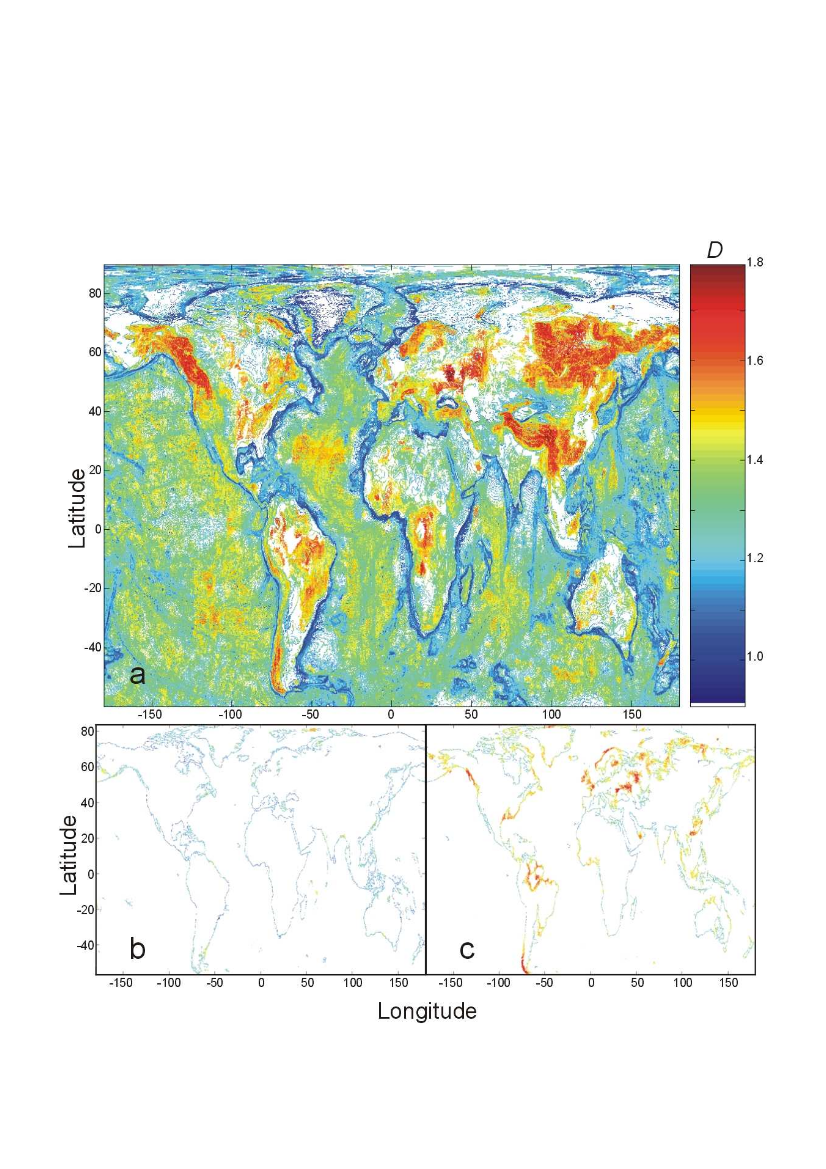
Fig 2. A terrestrial world map with the local fractal dimensions of terrestrial isolines.
In Figure 2a, we show a terrestrial world map with the local fractal dimensions of terrestrial isolines. With the purpose of illustrating graphically the qualitative variation of fractal dimension, we have averaged its value over small cells, such that each coloured area in the plot corresponds now to a region of 0.1° latitude x 0.1° longitude, its colour standing for the average fractal dimension of (isolines contained in) the cell. This procedure amounts to averaging the measures D(lon,lat,h) with respect to a narrow interval of elevations, and yields a fractal dimension depending on two parameters, lon and lat (once more, for simplicity, we refer to the measure as D).
For comparison, we summarize in figure 3 the results yielded by performing the same analysis for the Lunar surface. Remarkably, and despite the visible difference in cratering between the two longitudinal hemispheres of the Moon, we obtain a distribution of fractal dimensions almost independent of longitude and latitude (but see below). It is straightforward to conclude that the large-scale, global topography of the Moon is well described by an average fractal dimension between 1.2 and 1.3. These results give further support to the independence of physical processes with longitude and latitude.

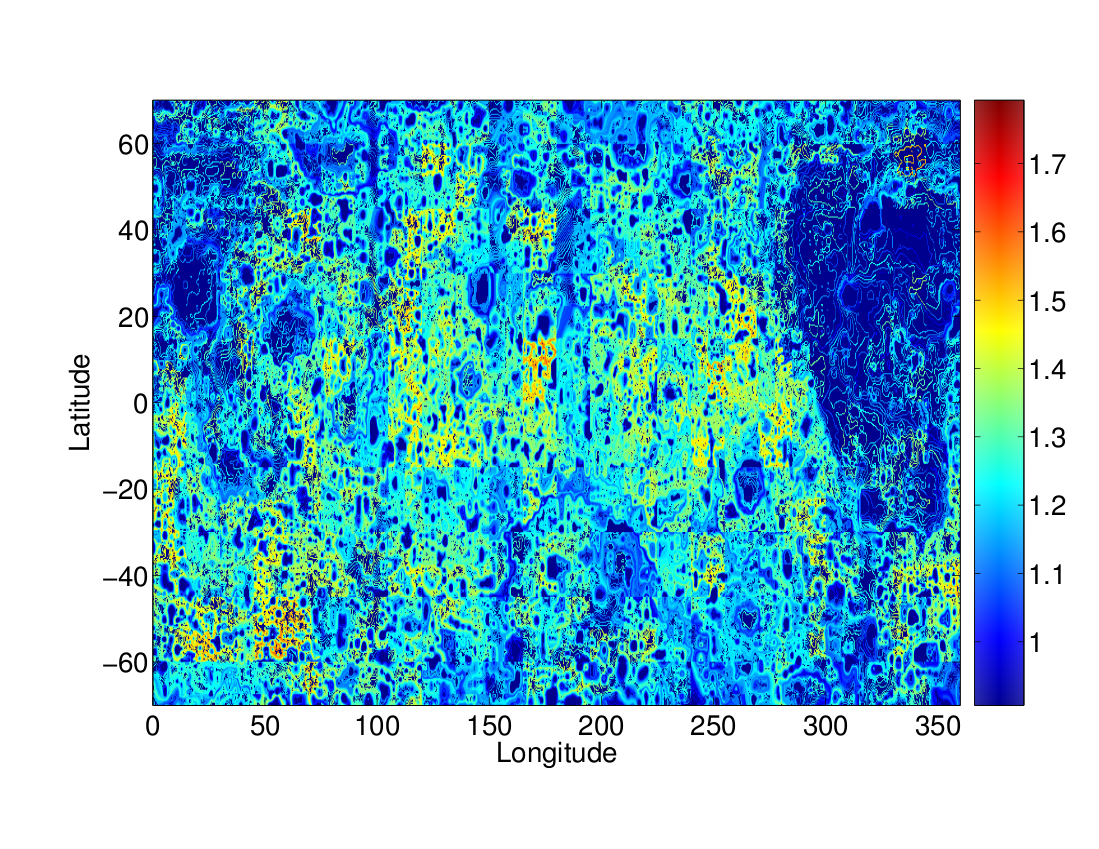
Fig 3. Local fractal dimensions of Lunar surface.
The map depicted in Fig. 2a shows several interesting features. Low fractal dimensions (deep blue areas) correspond to smooth regions in oceans: trenches, continental slopes, and continental platforms. These are either regions with steep slopes (trenches and continental slopes) or smooth areas due to the action of processes such as erosion by water and deposition by marine currents (continental platforms). No regions on continents display such low dimensions, with the exception of areas permanently covered by ice (and because elevation measures are taken on top of ice).
Fractal dimensions notably increase along the mid-ocean ridge. Moreover, isoline roughness is higher in regions where transform faults are more abundant (North Atlantic, Indian, and South Pacific oceans). Abyssal floors are to be found between the ridge region and the continental platforms, and display a fractal dimension of isolines about 1.3 (dominance of greenish colour). Coastlines signal the boundary between oceanic and continental regions, and are unambiguously identified by our analysis.
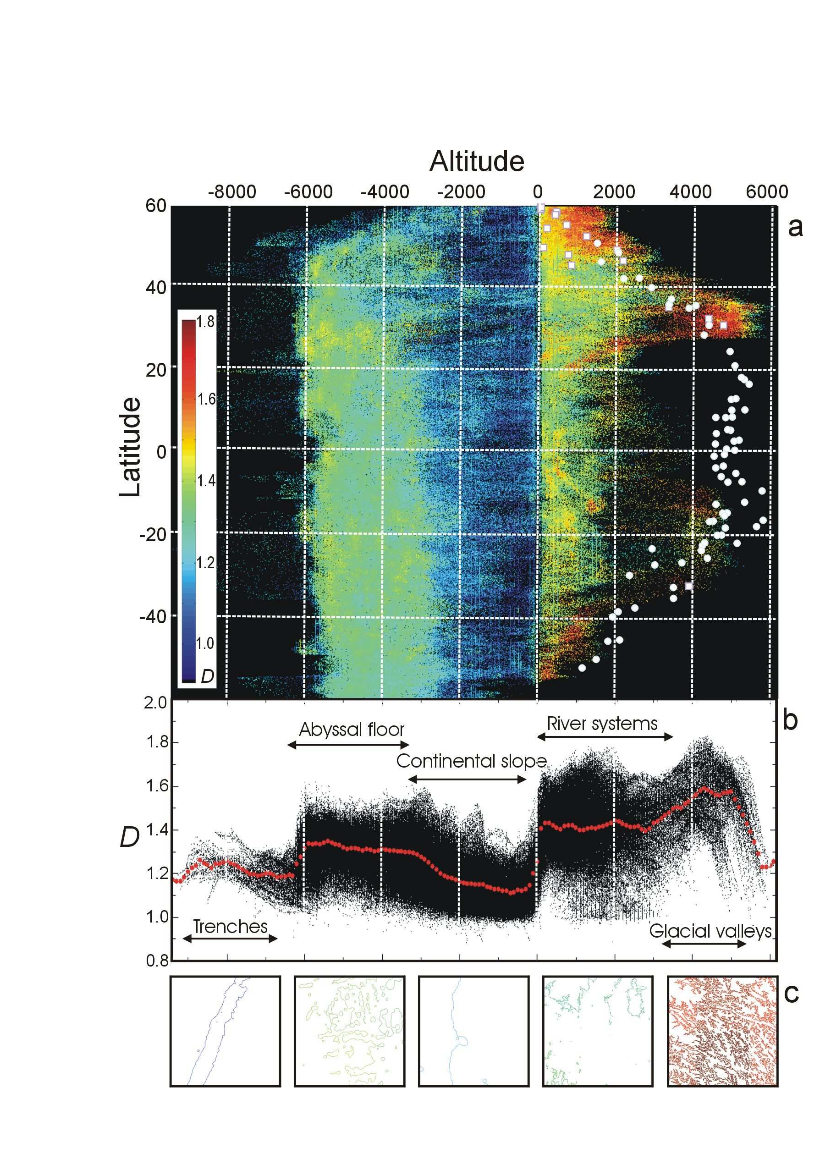
In order to disentangle the effects of the different processes, we plot in Fig. 3a the fractal dimension as a function of latitude and elevation, averaged over longitude. The figure allows us to attempt a correlation between average local fractal dimension of isolines and major terrestrial geomorphologic features.
f
References
[1] A.Baldassarri, M.Montuori,O.Prieto-Ballesteros, S.Manrubia “Fractal properties of isolines at varying altitude reveal different dominant geological processes on Earth” Journal of Geophysical Research, vol . 113, E09002 (2008)
