Regularities and universality in large-scale social phenomena
In social phenomena every individual interacts with a limited number of peers, usually negligible as compared with the total number of people in the system. In spite of that, human societies are characterized by stunning global regularities. There are transitions from disorder to order, like the spontaneous emergence of a common language/culture or the creation of consensus about a specific topic. In order to understand the nature and the origin of such regularities it is crucial to characterize them in a quantitatively precise way, looking in particular for features that are universal, i.e. shared by different phenomena. The identification of such features is fundamental for devising sensible simple models able to reproduce the empirical observations and suitable for theoretical investigation.
Elections
One of the social phenomena for which the statistical physics approach is most natural is opinion dynamics. A lot of activity has been devoted in recent years to the study of the behavior of statistical physics models that incorporate simple mechanisms of interaction among individuals. The empirical investigation of phenomena of opinion dynamics in the real world, looking for robust signatures of collective phenomena, has attracted much less attention. Elections are a real world phenomenon where the opinion dynamics among voters gives rise to measurable effects. We consider in particular proportional elections with open lists, where voters can express their choice not only for a party but also for single candidates within the party list. If one computes the distribution of the number of votes obtained by each candidate one finds a broad curve, that depends both on the party and on the country considered. In order to factor out the role of the parties (associated with policy-related issues) and focus on the competition of different candidates inside the parties we compute instead the distribution of the relative performance of candidates, defined as v/v0, where v is the number of votes obtained by the candidate and v0 is the average number of votes obtained by candidates in the same list.
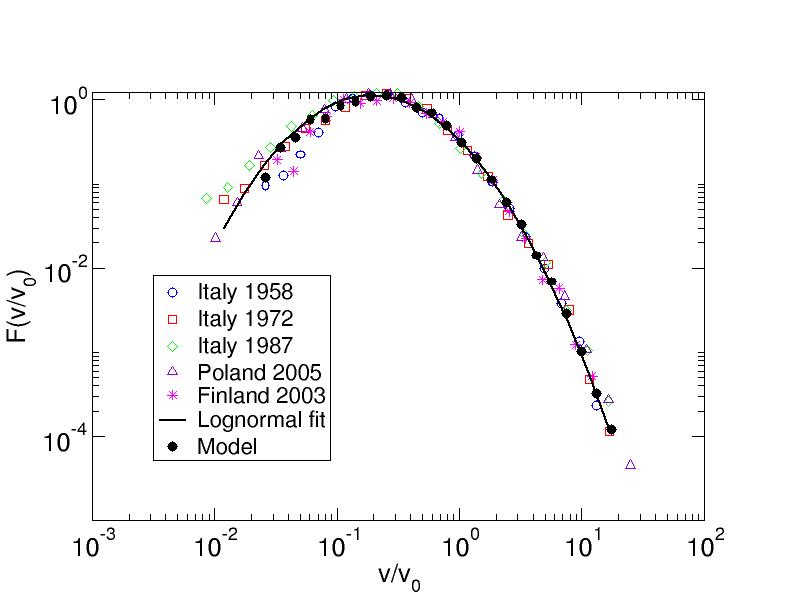
It turns out (see the figure) that such distribution is universal, i.e. it does not depend on the party considered nor on the country where the election takes place. The form of the universal curve is well fitted by a lognormal distribution and is reproduced by a simple model based on a ‘word-of-mouth’ spreading mechanism in the network of electors. For more information see
S. Fortunato and C. Castellano
Word of mouth and universal voting behaviour in proportional elections
Phys. Rev. Lett. 99, 138701 (2007). [arXiv:physics/0612140]
Citation analysis is a bibliometric tool that is becoming increasingly popular to evaluate the performance of different actors in the academic and scientific arena, ranging from individual scholars, to journals, departments, universities and national institutions up to whole countries. The outcome of such analysis often plays a crucial role to decide which grants are awarded, how applicants for a position are ranked, even the fate of scientific institutions. It is then crucial that citation analysis is carried out in the most precise and unbiased way.
Citation analysis has a very long history and many potential problems have been identified, the most critical being that often a citation does not — nor it is intended to — reflect the scientific merit of the cited work (in terms of quality or relevance). Additional sources of bias are, to mention just a few, self-citations, implicit citations, the increase in the total number of citations with time or the correlation between the number of authors of an article and the number of citations it receives.
We have considered one of the most relevant factors that may hamper a fair evaluation of scientific performance: field variation.
Publications in certain disciplines are typically cited much more or much less than in others. This may happen for several reasons, including uneven number of cited papers per article in different fields or unbalanced cross-discipline citations.
A paradigmatic example is provided by mathematics: the highest 2006 impact factor (IF) for journals in this category (Journal of the American Mathematical Society) is 2.55, whereas this figure is ten times larger or even more in other disciplines (for example, New England Journal of Medicine has 2006 IF 51.30, Cell has IF 29.19, Nature and Science have IF 26.68 and 30.03, respectively).
The existence of this bias is well-known and it is widely recognized that comparing bare citation numbers is inappropriate. Many methods have been proposed to alleviate this problem. They are based on the general idea of normalizing citation numbers with respect to some properly chosen reference standard. The choice of a suitable reference standard, that can be a journal, all journals in a discipline or a more complicated set is a delicate issue. Many possibilities exist also in the detailed implementation of the standardization procedure. Some methods are based on ranking articles (scientists, research groups) within one field and comparing relative positions across disciplines. In many other cases {\em relative indicators} are defined, i.e. ratios between the bare number of citations c and some average measure of the citation frequency in the reference standard.
The use of relative indicators is widespread, but empirical studies have shown that distributions of article citations are very skewed, even within single disciplines. One may wonder then whether it is appropriate to normalize by the average citation number, that gives only very limited characterization of the whole distribution. This issue we have addressed. The problem of field variation affects the evaluation of performance at many possible levels of detail: publications, individual scientists,
research groups, institutions. We consider the simplest possible level, the evaluation of citation performance of single publications. When considering individuals or research groups, additional sources of bias (and of arbitrariness) exist, that we do not tackle. As reference standard for an article, we consider the set of all papers published in journals that are classified in the same Journal of Citation Report scientific category of the journal where the publication appears. We take as normalizing quantity for citations of articles belonging to a given scientific field the average number c0 of citations received by all articles in that discipline published in the same year. We perform an empirical analysis of the distribution of citations for publications in various disciplines and we show that the large variability in the number of bare citations c is fully accounted for when cf=c/c0 is considered. The distribution of this relative performance index is the same for all fields (see figure).
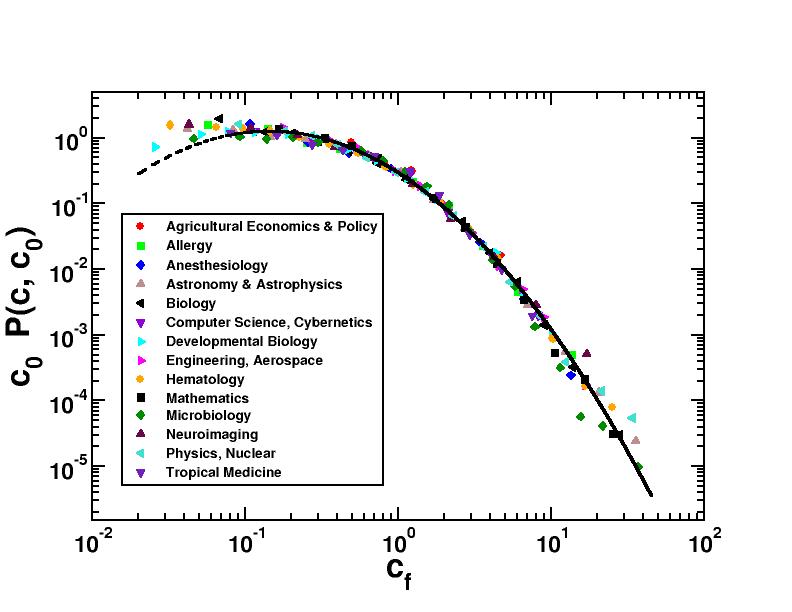
No matter whether, for instance, Developmental Biology, Nuclear Physics or Aerospace Engineering are considered, the chance of having a particular value of cf is the same. Moreover, we show that cf allows to properly take into account the differences, within a single discipline, between articles published in different years. This provides a strong validation of the use of cf as an unbiased relative indicator of scientific impact for comparison across fields and years. For more information see
F. Radicchi, S. Fortunato, and C. Castellano
Universality of citation distributions: Toward an objective measure of scientific impact
Proc. Natl. Acad. Sci. USA, 105, 17268 (2008) [arXiv:0806.0974]
