Volume collapse transition in Ce
Crystalline Ce has a remarkable phase diagram in that is the solid state analogue of a Van der Walls system with a line of discontinuous transitions ending at a critical point.
The two phases alpha and gamma have the same cubic symmetry and differ only on density just like water and vapor but in the solid state!.
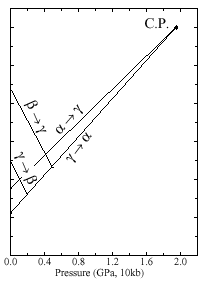
Fig 1: Phase diagram of Ce metal after Gschneidner Jr KA, Eyring L, editors. Handbook on the physics and chemistry of rare earths, vol. I. Amsterdam: North-Holland; 1979.
However unlike water and vapor the critical exponents close to the critical point are not three dimensional Ising critical exponents, as one would naively guess from symmetries, but classical (Gaussian) exponents. Also Ce has several other thermodynamics anomalies which we have explained with a non-linear elastic model.
As in Van der Walls theory the Gibbs free energy as a function of volume must have a double well minimum as in the following figure:
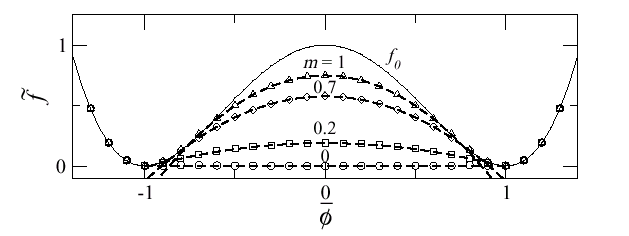
Fig 2: Free energy as a function of volume. The thin line is the free energy of the uniform system. The lines with dots are the free energies of the phase separated system with different values of the materials shear modulus. m=0 corresponds to a liquid in which the usual Maxwell construction is valid.
This double minimum is rooted on the peculiar contribution of the f electrons to the binding and is, essentially, a strong correlation phenomena. Also as in Van der Walls theory the region with negative curvature indicates an instability towards phase separation however unlike a liquid system, a macroscopically phase separated state is severely hindered in a solid unless the system fractures in two pieces. Indeed consider a single crystal in the phase separated region. One part of the crystal will have a smaller unit cell than the other and large strains will appear on the interface if the crystalline order is to be preserved. A related problem is: suppose one starts from the small volume phase (gamma) and slowly reduces the pressure. How does the system nucleates a high volume unit cell in the background of small volume units cells preserving the crystal integrity? The following pictures sketches the situation that is created:
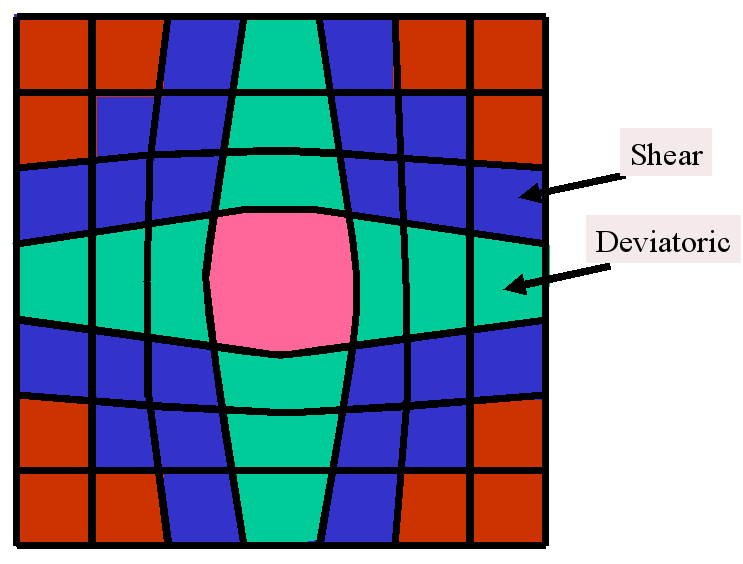
Fig 3: Sketch of strains on solid on solid isostructural nucleation. When a large unit cell (center) is nucleated on an environment of small unit cells (red) deviatoric and shear strains appear at the interface.
One readily see that not only dilation strains are involved (which describe volume change) but also shear and deviatoric strains which describe the deformation of a unit cell at constant volume. The stiffness which governs dilation strains is just the bulk modulus while the stiffness for deviatoric and shear strains is the shear modulus.
We have solved a statistical mechanics model of this problem taking into account not only the double well, which is due to strong correlation, but also the elastic interactions which can not be neglected (see the paper attached below). If we set the shear modulus to zero then one recovers the physics of a liquid. Phase separation proceed by the usual Maxwell construction. This is shown in Fig. 2 in the curve labeled m=0. For a finite shear modulus the phase separation is frustrated thus the phase separation states have larger energy as shown in Fig. 2 for m>0 (m is proportional to the shear modulus). This is elastically frustrated phase separation and is similar to the Coulomb frustrated phase separation discussed elsewhere in this site.
It turns out that the model we have considered can be solved exactly at finite temperatures. This allow us to predict several characteristics of the phase diagram of Ce and related compounds. This phase diagram is very anomalous because the elastic interactions are long range. This long range character is ultimately rooted on the fact that elasticity in crystals is the consequence of a broken continuous symmetry, namely translation, leading to gapless Goldstone modes (sound waves).
In the case of Ce where the order parameter is the density (or the unit cell volume) the long range effect of elasticity has dramatic consequences. The first one is that the interface energy is not any more proportional to the surface. This can be already guessed from the sketch of Fig, 3 where one sees that the interface effects are not localized in a small interface layer. Another way to see this is to solve the elastic problem of a planar interface between alpha and gamma cerium. The solution which preserves the crystal integrity at the boundary is sketched for a 2D system at the left in the following figure:
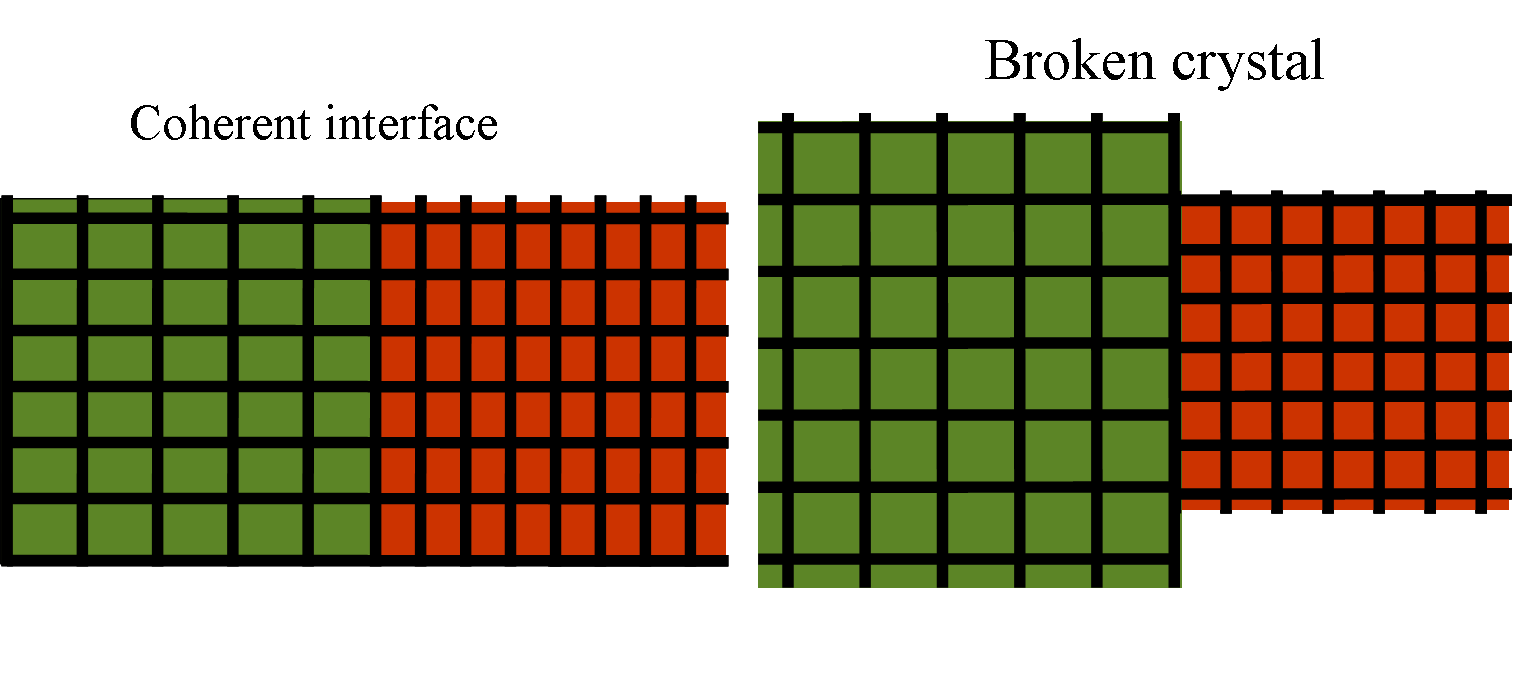
Flat interface between a high volume and a low volume phase. The left figure represents the solution preserving the lattice integrity. The right figure is the broken crystal.
In order to keep the lattice integrity a squared unit cell becomes an horizontal rectangle on the left and a vertical rectangle on the right. If the strain is too large the crystal just brakes relaxing the strain and one obtains the situation on the right. One learns form this picture that surface energies in elastic systems are very unusual. The effect of the interface does not decay as the distance from the interface increases. Elastic effects are infinite range!.The energy that is gain by relaxing the strain on the left is proportional to the volume and not the surface. Therefore the interface energy is proportional to the volume. This can be seen explicitly resolving exactly a non linear elastic model (see the article below).
This anomalous interface energy leads to several thermodynamics peculiarities. Nucleation becomes forbidden in a certain range of pressures around the pressure of thermodynamic equilibrium. Therefore the transition can not proceed at equilibrium. Instead the transition occurs when the system arrives to the limit of stability of the metastable phase. This implies that a region of intrinsic hysteresis appears around the equilibrium pressure. The following curves show the pressure vs. the volume for different temperatures from T=0 up to a temperature larger than Tc, the temperature of the critical point. For T=0 we show also the path the system follows when decreasing the pressure (blue) and when increasing (red).
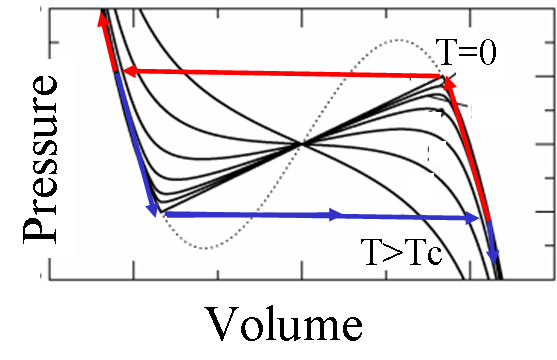
Pressure volume curves at different temperatures. We show the hysteresis cycle in the T=0 case.
The following figure shows the wedge of forbidden nucleation in the pressure volume phase diagram.
Phase diagram of the non-linear elastic model of a volume collapse transition. m is proportional to the shear modulus and parametrizes the degree of frustration introduced by the elastic forces. Inside the wedge there is intrinsic hysteresis. The dots are experimental point in the related system, Gd doped SmS.
The order parameter in this transition, as for the liquid gas transition, can be taken as the density or the unit cell volume. The effect of elasticity is to introduce an infinite range density-density interaction. The effect of this interaction is to make mean-field theory exact. Therefore critical exponents around the critical point are predicted to be Gaussian critical exponents which is in good agreement with experiment. To know more about the anomalous thermodynamic of Ce and related systems read this paper.
José Lorenzana
This work has been done in collaboration with Eduardo Jagla and Sebastian Bustingorry from Instituto Balseiro, Argentina.

